Network Traffic Analysis
This section will cover network traffic analysis.
Table of Contents
- Introduction
- The Analysis Process
- Analysing Traffic Using Tcpdump
- Monitoring Traffic Using Tcpdump
- Packet Filtering Using Tcpdump
- Analysing Traffic Using Wireshark
- Display Filters
- Statistics and Analyze Tabs
- Following a Stream
- Downloading Captured Files
- Decrypting RDP/TLS Connections
Introduction
Knowing how to analyse network traffic can help in investigations, improve incident response, and better understand the network and any incidents that occur.
The Analysis Process
Network traffic analysis is a dynamic process that can change depending on our tools, permissions, network visibility, and more. The goal is to provide a repeatable process to use when we are performing analysis.
Before starting, we will need to define some goals and questions that we can look at when performing analysis:
- What is the issue? i.e., Potential breach, network issues, etc.
- What are the goals and scope? i.e., known malicious files, past 24 hours.
- What are the targets? i.e., 192.168.1.0/24 network, HTTP protocol.
Once we defined the objectives, we will need to define the steps needed to achieve them:
- How can we obtain the traffic?
- What tools should be used to perform analysis?
- How can we determine malicious traffic from normal traffic?
When performing analysis, always look for unique events, patterns, and checking host to host. Looking for unique events and patterns may reveal something that is abnormal and may prompt for a deeper look.
To effectively perform analysis, we should know our environment such as, knowing the assets, baselines, and more, placing the host to capture packets at an effective location, and persistence as issues may not always be easy to detect.
Analysing Traffic Using Tcpdump
Tcpdump is a command-line tool that can be used to sniff packets. It can directly capture and interpret data frames from a file or network interface.
As direct access is required to capture network traffic, we will usually require root privileges. This means that we will need to run tcpdump using sudo. The following command will output tcpdump version information.
sudo tcpdump --version
Monitoring Traffic Using Tcpdump
The following table will display some useful switches (options) that can be used with thetcpdump command.
| Switch | Description |
|---|---|
| -D | Display available network interfaces to capture traffic. |
| -i | Specify the interface to capture traffic on. For example, tcpdump -i ens33. |
| -n | Do not resolve hostnames. |
| -nn | Do not resolve hostnames or well-known ports. |
| -e | Capture the ethernet header along with upper-layer data. |
| -X | Show the contents of packets in hex and ASCII. |
| -XX | Show the contents of packets in hex and ASCII with the ethernet headers. |
| -v, vv, vvv | Enable and increase the verbosity. |
| -c | Capture a specific number of packets. |
| -s | Define how much of a packet to capture. |
| -S | Change the sequence numbers from relative to absolute in the capture. |
| -q | Print less protocol information. |
| -r | Specify the pcap file to read from. |
| -w | Specify the file to write to. |
To list available interfaces that we can capture packets from, we can use the -D switch.
sudo tcpdump -D
To listen on an interface, we can use the -i switch and specify the interface.
sudo tcpdump -i ens33
If we do not want to resolve IP address and port numbers to their hostnames and common port names (i.e., 80 > HTTP), we can use the -nn switch.
sudo tcpdump -i ens33 -nn
It is also possible to combine switches. An example will be if we want to display the ethernet headers (-e), disable resolution (-nn), and display the output in both hex and ASCII (-X), we can use the following.
sudo tcpdump -i eth0 -ennX
To read from an existing PCAP file, we can use the -r switch.
sudo tcpdump -r /path/to/file.pcap
To write the output to a file, we can use the -w switch.
sudo tcpdump -w /path/to/file.pcap
Packet Filtering Using Tcpdump
The following table are some filters that can be used with tcpdump to filter traffic.
| Filter | Description |
|---|---|
| host | This will filter visible traffic to show anything involving the designated host. It is bi-directional. |
| src/dest | These are modifiers. It can be used to specify a source or destination host or port. |
| net | This filter will show any traffic with the source or destination of the specified network. |
| proto | This filter will display the specified protocol type. |
| port | This filter will display any traffic from the specified port as the source or destination. It is bi-directional. |
| portrange | This filter will display any traffic from the specified port range as the source or destination. |
| less/greater | This filter can be used to look for specific sizes for protocol option or packet size. |
| and/&& | This filter can be used to concatenate two different filters together. For example, src host AND port. |
| or | This filter allows for a match on either two conditions. This means that any one condition just have to match. |
| not | This filter is used to exclude specified packets. |
To filter traffic to display packets from a specified IP address, we can use the host filter.
sudo tcpdump -i <interface> host <IP Address>
An example:
sudo tcpdump -i eth0 host 10.10.1.203
To specify if the IP address is the source or destination, we can use the src or dest filter respectively.
sudo tcpdump -i <interface> src host <IP Address>
To filter for a port, we can use the port filter. Additionally, we can use the src or dest filters to specify if the port is from a source or destination.
sudo tcpdump -i <interface> <protocol> <src/dest> port <port number>
An example if we are filtering for port 80 as the source.
sudo tcpdump -i eth0 tcp src port 80
To filter for a network, we can use the net filter. Additionally, we can use the src or dest filters to specify if the network is the source or destination for a packet.
sudo tcpdump -i <interface> <src/dest> net <Network IP Address>/<CIDR>
An example if we want to view traffic from the 10.0.2.0/24 network:
sudo tcpdump -i ens33 net 10.0.2.0/24
To filter for a specific protocol, we can use the proto filter.
sudo tcpdump -i <interface> proto <protocol>
An example if we want to filter for all TCP packets. We can use either command:
sudo tcpdump -i eth0 tcp
sudo tcpdump -i eth0 proto 6
To filter for the protocol and port, we can use the following:
sudo tcpdump -i <protocol> port <port number>
To filter from a port range, we can use the portrange filter.
sudo tcpdump -i <interface> portrange <range>
An example will be filtering traffic from port 0 to 500.
sudo tcpdump -i ens33 portrange 0-500
To filter traffic with a specific packet size, we can use the less or greater filter.
sudo tcpdump -i <interface> <less/greater> <size>
An example will be filtering for packets smaller than 500 bytes.
sudo tcpdump -i ens33 less 500
To filter for traffic where it has to match two conditions, we can use the and filter.
sudo tcpdump -i <interface> <condition1> and <condition2>
An example where if we want to filter only for the IP address of 10.1.1.221 with the source port of 443.
sudo tcpdump -i eth0 host 10.1.1.221 and src port 443
To filter for traffic where we only require one condition to match, we can use the or filter.
sudo tcpdump -i <interface> <condition1> or <condition2>
To filter for traffic where we do not want a specific condition, we can use the not filter.
sudo tcpdump -i <interface> not <condition>
Analysing Traffic Using Wireshark
Wireshark allows us to analyse network traffic using a GUI. It is also able to capture traffic on different interfaces such as USB and Bluetooth and allows us to save the capture in several formats.
To start a capture, simply select the interface to capture from. To save the capture, navigate to File > save on the top left.
Wireshark uses the BPF syntax when filtering for results.
The following table will list some filters that can be used with Wireshark.
| Filter | Description |
|---|---|
host <IP address> | Specify the IP address of a specific host. |
net <IP address>/<CIDR> | Specify a specific network. |
| src/dst | Specify the source or destination to filter. |
port <port number> | Specify the port number to display. |
not port <port number> | Specify to display all ports but the specified port. |
| and | Used to concatenate multiple filters. |
| portrange | Used to filter for a specific port range. |
| ip/ether/tcp | Used to filter for the specified protocols from the traffic. |
| broadcast/multicast/unicast | Used to filter for the specified traffic. |
Wireshark also have their own propriety filters called "Display Filters".
Display Filters
In Wireshark, we can also use display filters, which are specific to Wireshark. Display filters allows us to filter for specific packets or traffic. The following table will list some useful display filters.
| Display Filter | Description |
|---|---|
| ip.addr | Used to filter for a specific IP address or network using CIDR. |
ip.<src/dst> | Used to specify if the IP address is the source or destination. |
| tcp.port | Filter for a specific TCP port. |
| udp.port | Filter for a specific UDP port. |
| tcp.srcport | Used to specify the protocol as the source port. Replace tcp with udp for UDP. |
| udp.dstport | Used to specify the protocol as the destination port. Replace udp with tcp for TCP. |
<tcp/udp>.stream | Filter for a specific stream. |
| and/or/not | Match multiple conditions, either one of conditions, or match all that does not equals to the specified condition. |
The following table will display some operators that can be used with the display filters to perform matching.
| Operator | English | Description |
|---|---|---|
| == | eq | Equals to. Used to match the specified value. |
| != | ne | Not equals to. Used to match everything but the specified value. |
> | gt | Greater than. Used to match packets greater than the specified value. |
=> | ge | Greater than or equal to. Used to match packets that is equal or greater than the specified value. |
< | lt | Lesser than. Used to match packets lesser than the specified value. |
<= | le | Lesser than or equal to. Used to match packets lesser than or equal to the specified value. |
For more filters and operators, visit the official documentation.
https://www.wireshark.org/docs/wsug_html_chunked/ChWorkBuildDisplayFilterSection.html
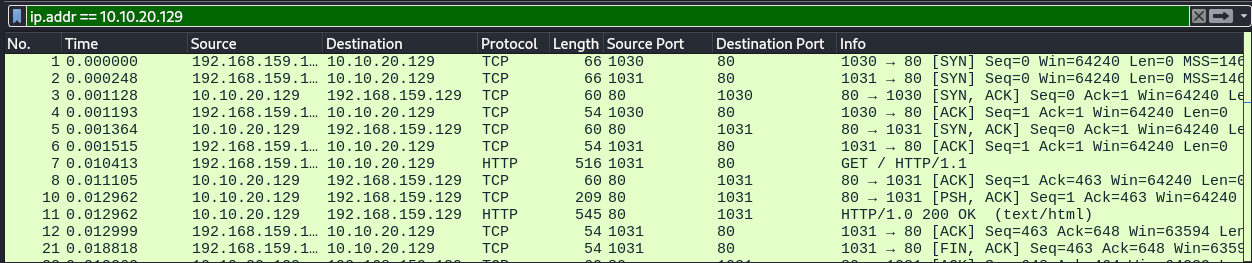
If we want to view packets by a specific host, we can use the ip.addr filter.
ip.addr == <ip address>
ip.addr eq <ip address>
An example will be where we want to filter traffic from the IP address of 10.10.20.129.
ip.addr == 10.10.20.129
To filter for a specific network, we can specify the network address in CIDR notation.
ip.addr == 10.1.20.0/24
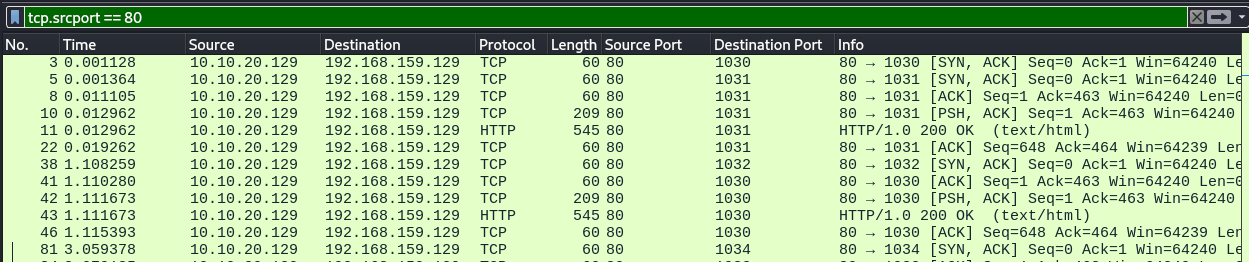
To filter for a specific port, we can use the tcp.port or udp.port filter. Additionally, we can use tcp.srcport or udp.dstport to specify if the port is the source or destination.
tcp.port == <port number>
udp.port == <port number>
udp.srcport != <port number>
tcp.dstport > <port number>
An example will be filtering for TCP port 80 as the destination.
tcp.srcport == 80
To match with multiple conditions, we can use and.
<condition1> and <condition2>
An example will be where we want to only display traffic to and from TCP ports 80 and 1030.
tcp.port == 80 and tcp.port == 1030

To match either one of multiple conditions, we can use or.
<condition1> or <condition2>
To match everything but the specified condition, we can use not.
not <condition>
Statistics and Analyze Tabs
On the top left, we can see a tab named "Statistics". This tab allows us to view statistics such as all IPv4 and IPv6 addresses captured.
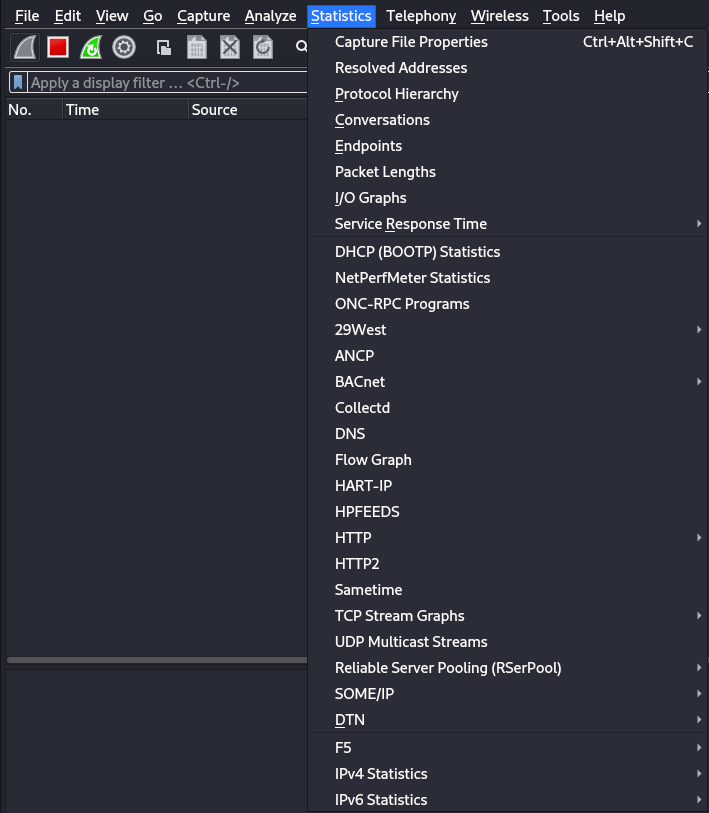
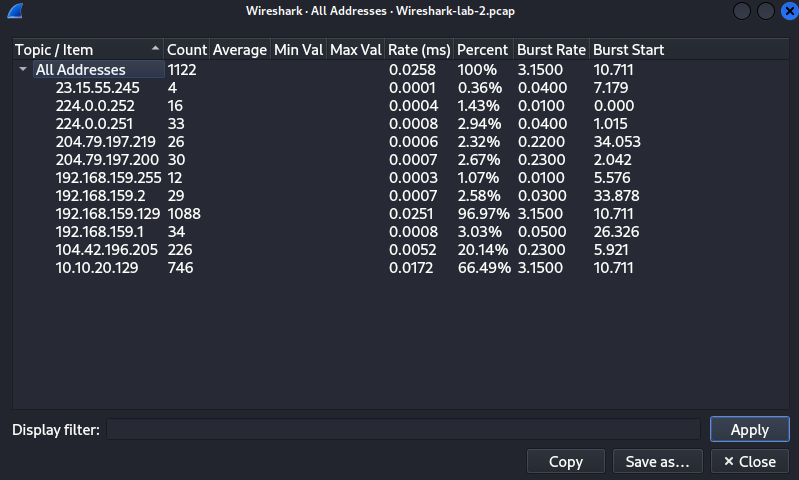
An example will be where we want to view all IPv4 addresses captured. We hover over "IPv4 Statistics" and select "All Addresses", we can view all IPv4 addresses captured.
The "Analyze" tab allows us to perform actions such as following TCP streams, filter conversations, prepare new packet filters, and more.
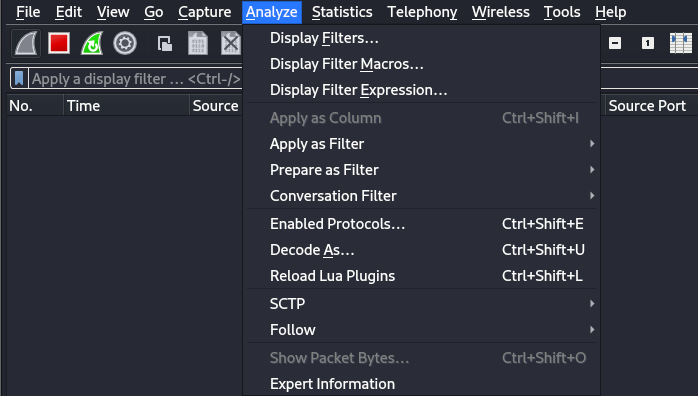
Following a Stream
Following streams allows us to see the information being exchanged. To follow a stream, we can select the packet that we want to follow and either navigate to the Analyze tab > Follow or right click the packet and select "Follow".
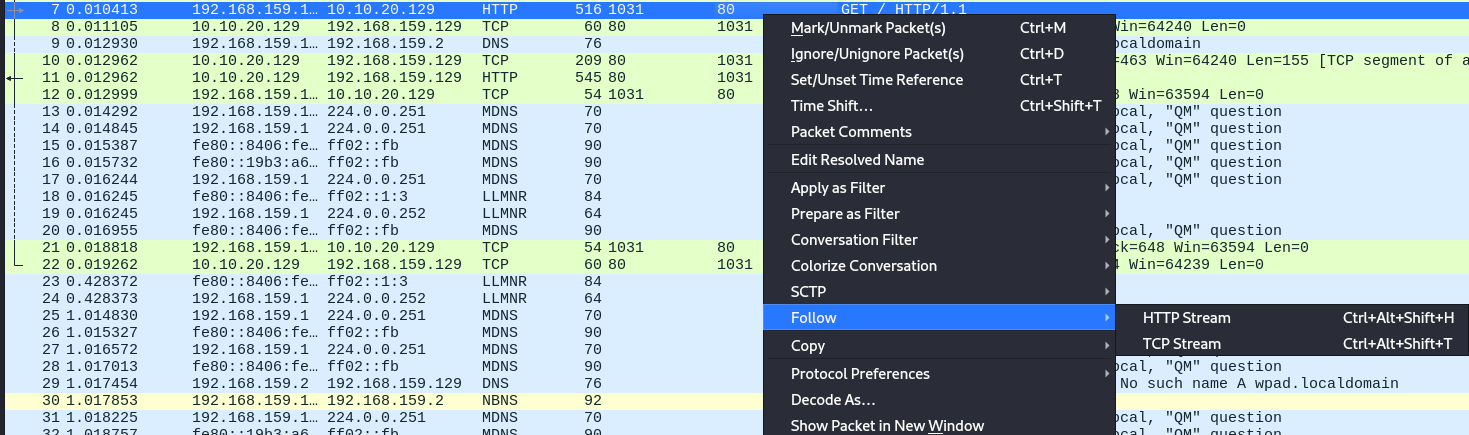
An example will be following a HTTP stream.
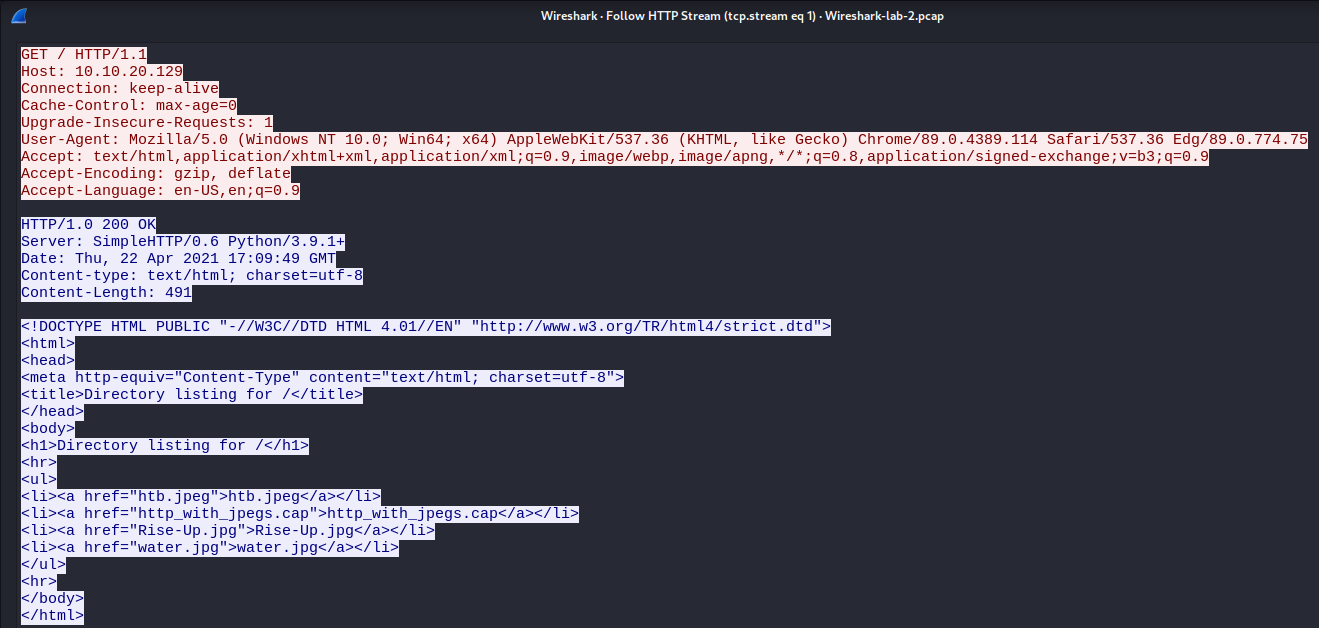
We can see the entire conversation of the HTTP stream in the above screenshot with information such as the HTTP headers and the content.
To filter streams, we can use filters such as tcp.stream or udp.stream.
tcp.stream eq <stream number>
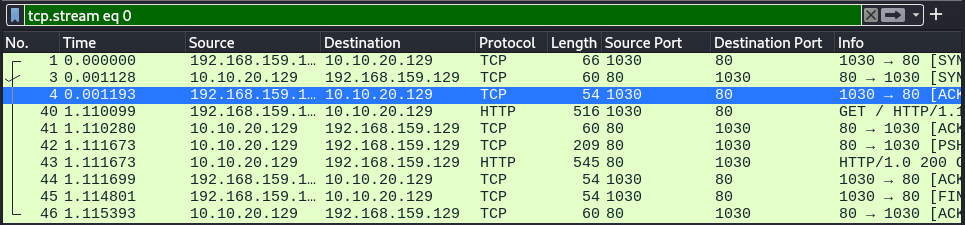
An example will be filtering for the first TCP stream.
tcp.stream eq 0
Downloading Captured Files
If the capture contains files such as HTML files from a website, we can download the file for further analysis by navigating to the "Files" tab > "Export Objects" and selecting the object type.
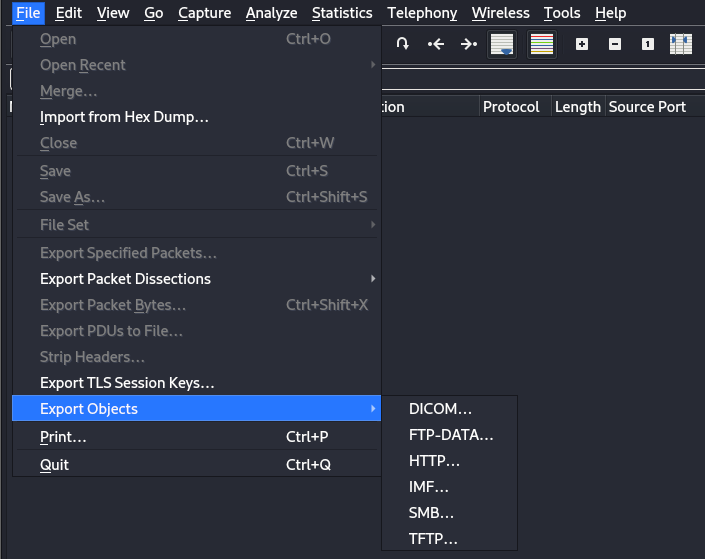
An example will be exporting HTTP objects.
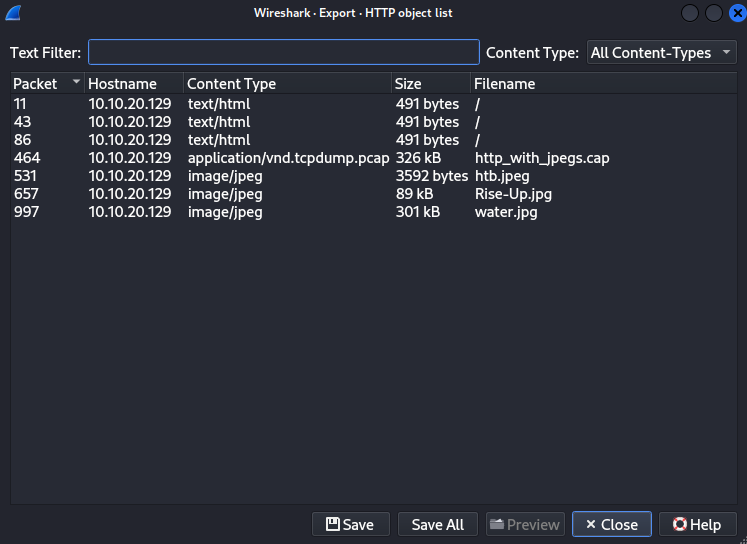
We can see all the files transferred via HTTP in the above screenshot alongside other information such as the host IP address and packet number.
If files are transferred using other methods such as FTP, we search for ftp-data and follow the TCP stream. To download the file, we can set the "Show data as" to raw and click the "Save as" button.
Decrypting RDP/TLS Connections
As RDP traffic is encrypted using TLS by default, capturing the traffic with tools such as Wireshark will not yield usable information. However, if we are able to obtain the RDP key, we are able to use it in Wireshark to decrypt the traffic.
The steps shown here can also be used to decrypt similar traffic that uses TLS for encryption.
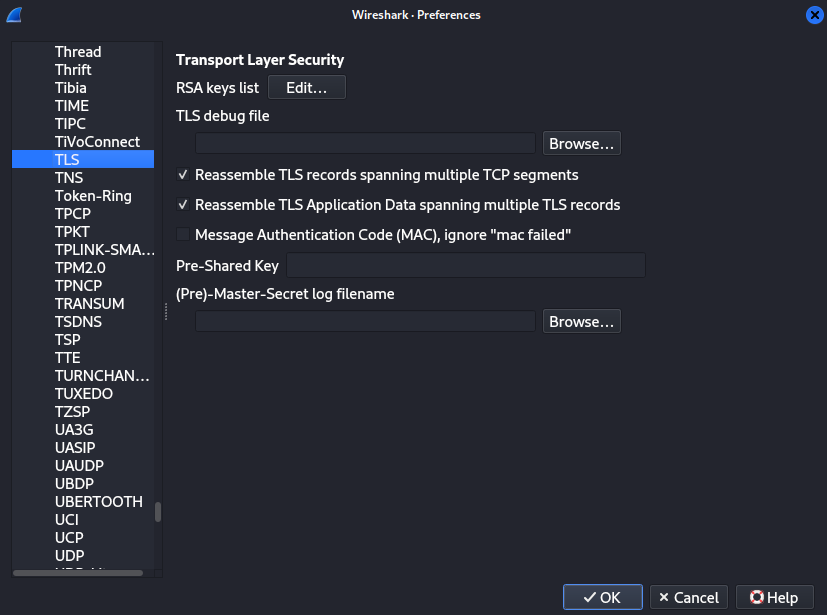
To decrypt an encrypted session with a key, we can navigate to "Edit" > "Preferences" > "Protocols" > "TLS" and click the "Edit..." button beside the RSA keys list.
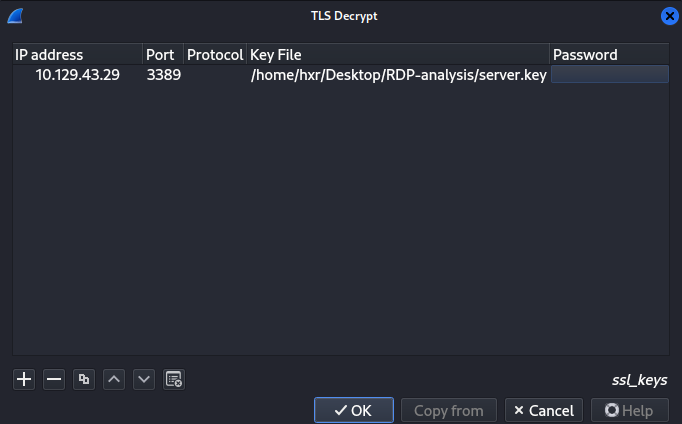
Once in, click the "+" button at the bottom left. We will need to specify the IP address, port, protocols, and they key.
In this example, the IP address will be the RDP server, the port will be 3389 (RDP default port, change accordingly), the protocol can be blank, and the key file will be the key to use to decrypt the traffic.
Once done, we can save and exit by clicking the "OK" button. Once done, we can filter for the encrypted traffic again and view it. In this example, RDP.
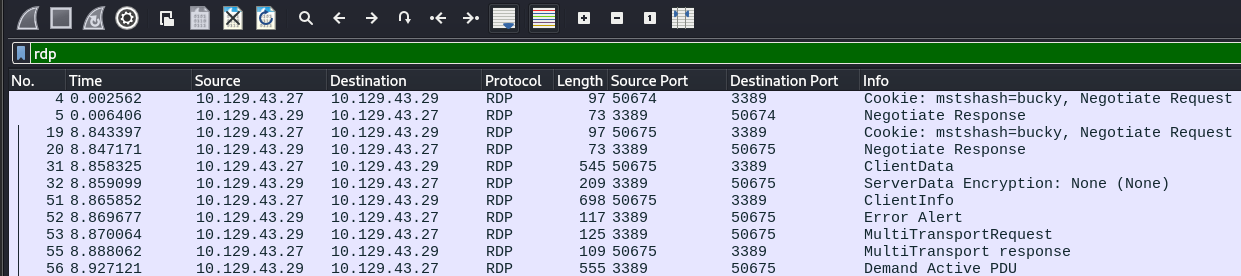
From the above screenshot, we are able to view the traffic that was previously encrypted using TLS.